This is an example of one of my homework assignments for class. It shows how I was able to take a data set for a reach in Walker Creek and analyze it to determine aspects relating to peak flow and hydraulic geometry.
The flood frequency analysis I created gave me information on recurrence intervals of Walker Creek at Bane, Va. The data fit the assumed distribution well, except for a few outliers from 2 extreme floods in 1992 and 1878. The 1,2,5, and 10 year recurrence intervals were determined to be 2000 cfs, 6000 cfs, 10000 cfs, and 11000 cfs respectively.

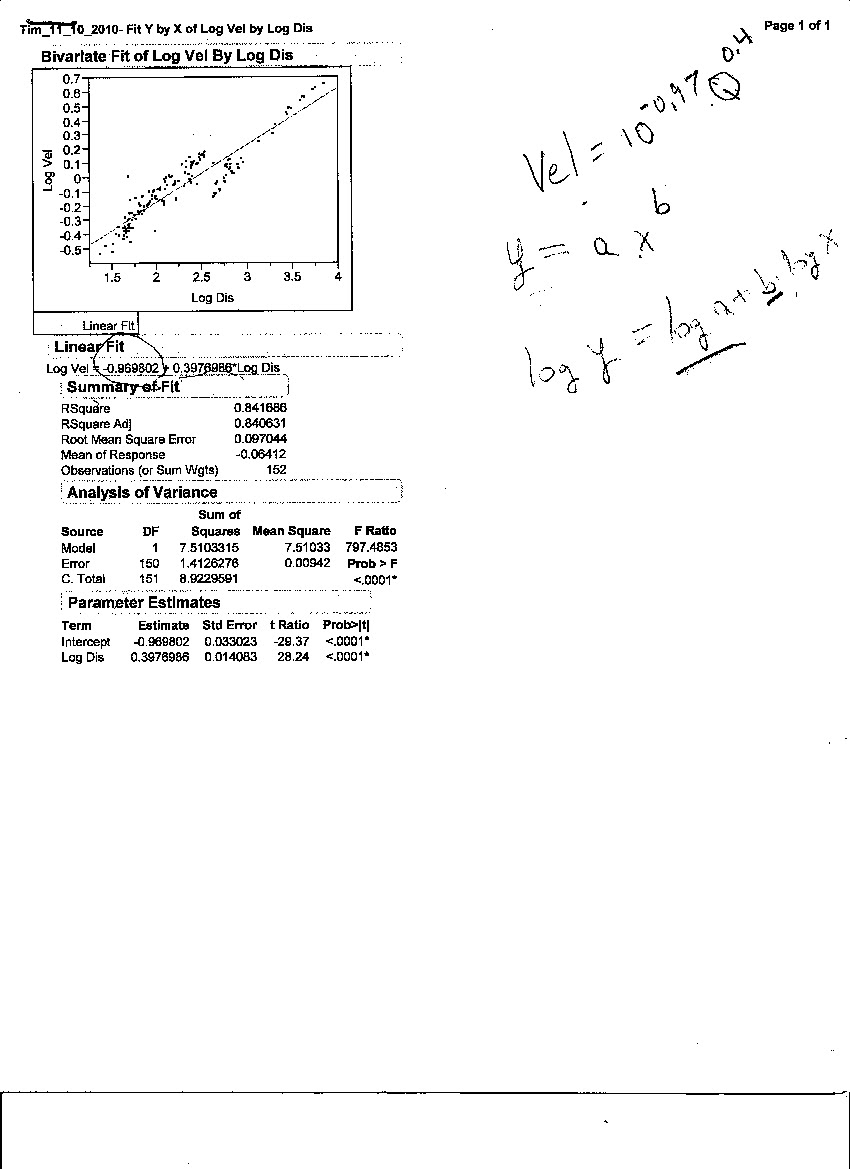
I developed plots of wetted width, mean depth and mean velocity as functions of measured discharge, to understand more about the hydraulic geometry. I noted that below the 1 and 2 year R.I. floods, the mean depth and wetted width change quickly with increases in discharge and then stay pretty much the same above these high levels of discharge. The mean velocity is similar but seems not to level off as much as the other two.After that, I was able to derive the estimates of coefficients and exponents and describe goodness of fit of the data set to these models. Rsquare for mean velocity was 0.842, Rsquare for wetted width was 0.783, and Rsquare for mean depth was 0.909. This would indicate that mean depth has much better fit to the regression than the other two variables do. Wetted width has the lowest Rsquare, which makes sense as eventually with increased discharge the wetted width will not change as much at the upper limits. The estimates of coefficients for the three were: v= 0.1072Q^2.4986 w= 35.7643Q^ 1.6573 d= 0.2608Q^2.4149


No comments:
Post a Comment