Dr. Orth,
I have enjoyed this semester very much. I liked your approach to teaching the subject of stream habitat management. I don't always learn when I am in a class that consists of boring lectures and tests with specifics that I only remember for the short term. I can truthfully say that leaving your class I have knowledge that will remain with me throughout my career. I liked the fact that there were many types of assignments that allowed me to learn from different angles. I filled out the background knowledge sheet you provided us before and after the semester and can honestly say that I improved on almost every concept, principle or descriptor. The rhetorical precis and reflective analysis helped me to be better prepared for class as I had to read the papers in detail. They are also nice in that I will always have them to jog my memory about papers I have already read and can quickly review the main points for future research needs. The blog was fun, as I had never done anything like it before. It was a good learning tool as I was able to read other people's posts and apply it to what we were doing in class. I also liked the discussions, as I was able to critically think about the issues and share my opinion. I also learned a lot seeing it from other people's points of view. Lastly, I liked developing the principles, because it made me step back and think of everything involved in this science. It helped me think of the principles from scientific, stakeholder, legislative, and the animals' points of view.
The parts I enjoyed the most were hands on. I enjoyed the fields trips to the New River and Stoney creek, as well as my group excursion to Crab creek. I wish there were more! I know we are graduate level students, and don't need anyone to hold our hands. But with busy lives and other classes, it is hard to remember you need to get out and kick around and learn something on your own without someone assigning it. I thought it would be helpful to assign groups and specifically require one or two trips with a short report for homework to get us outside. I think I would have learned more in a situation like this.I liked looking at the broad view of what we were learning this semester and trying to apply it when I was doing field work. Although our group didn't finish the Stoney creek lab, it was great to see how important planning can be when trying to get field work done. Managing people is as big a part of the job as trying to rehabilitate the reach of stream one is giving. It was also humbling to think of how much money and time went into a project like the one on Stoney creek. I was also able to put into perspective how important monitoring is at a site like that one. The New River trip helped me think more about the various requirements for fish. Every fish has its own niche. Therefore, managers need to remember to think outside the box when approaching a task like providing habitat for the entire fish community. Also, I was able to think about the fact that fish use certain habitats parts of the time and other habitats at other times. This would mean it is necessary to study the entire life history of a species of concern and provide multiple habitats for their existence. The Crab creek survey helped me understand how to gather information and analyze it on a reach of stream. There were more aspects we could have tried to study, but we all felt comfortable knowing how to gather them. The trip also helped me to step back and just look at an altered stream and notice little things that could be done to make a big difference for the aquatic life. Some of these things were habitat structures in the channel and riparian buffer strips, as well as vegetation on the banks to provide shade.
I liked how we looked at overall concepts for approaching stream habitat management as opposed to specifics all of the time. I learned having a guiding image is one of the most important factors approaching any stream habitat rehabilitation project. Having goals, and then doing work and monitoring aspects of the stream to know if one has met those goals, is one of the most important things to remember. Also, having a multi-disciplinary approach is important. I am a biologist. I am not an engineer. Having some background knowledge is essential as far as hydro-engineering is concerned, but it is okay to step back and let a professional help when approaching alterations of stream reach. However, it is okay for me to step in and give my two cents to engineers about biological requirements of the animal communities. By working together we can all get much more done, as well as get more done in a shorter amount of time. I learned biological indicators are good ways to monitor rehabilitation projects. Fish, macroinvertebrates, plants and primary producers all tell the true tail of how well projects are working at taking a stream back to past unaltered states. The communities of animals evolved in unaltered streams, therefore providing information on how rehabilitated a reach may be. I very much like thinking about issues from an ecosystem point of view. Everything biologically is interconnected and not always obvious to the general bystander. I learned that hydrology is of course very important when approaching stream restoration. Having a background now in how to properly assess a stream will undoubtedly help in planning goals and figuring out remedies for altered reaches. I also liked to look at real life scenarios. This was the number one best way for me to understand the concepts in class. It showed the problem managers were faced with, how they approached tackling it, techniques to fix the problem, and monitoring results for how well it worked. I like case study examples very much and think this course could be even more helpful with more of these.
Thanks for an enjoyable semester. I hope I can use some of my knowledge in the future and hopefully apply it toward mussel and stream fish work. Hopefully we can turn around some of these populations in decline during my career.
Cheers,
Tim Lane
Tuesday, December 14, 2010
Hydrology HW
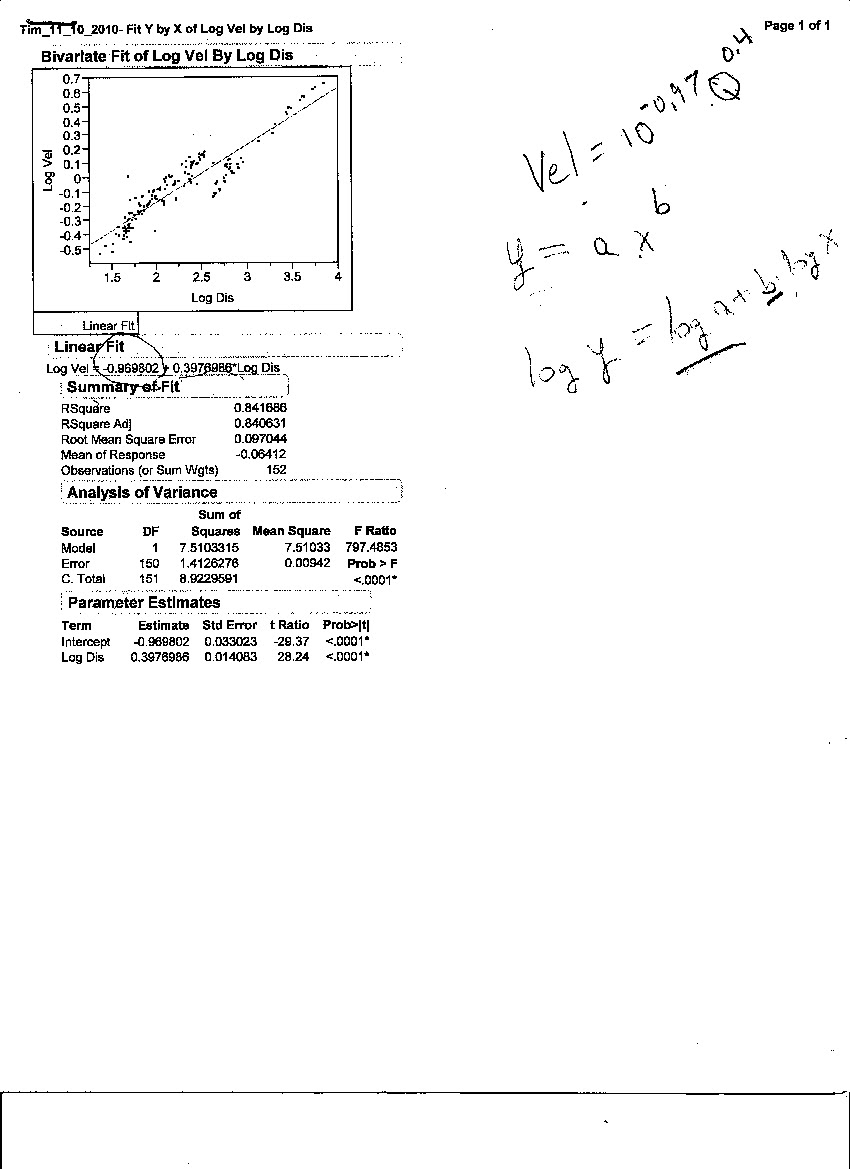
This is an example of one of my homework assignments for class. It shows how I was able to take a data set for a reach in Walker Creek and analyze it to determine aspects relating to peak flow and hydraulic geometry.

The flood frequency analysis I created gave me information on recurrence intervals of Walker Creek at Bane, Va. The data fit the assumed distribution well, except for a few outliers from 2 extreme floods in 1992 and 1878. The 1,2,5, and 10 year recurrence intervals were determined to be 2000 cfs, 6000 cfs, 10000 cfs, and 11000 cfs respectively.
 I developed plots of wetted width, mean depth and mean velocity as functions of measured discharge, to understand more about the hydraulic geometry. I noted that below the 1 and 2 year R.I. floods, the mean depth and wetted width change quickly with increases in discharge and then stay pretty much the same above these high levels of discharge. The mean velocity is similar but seems not to level off as much as the other two.After that, I was able to derive the estimates of coefficients and exponents and describe goodness of fit of the data set to these models. Rsquare for mean velocity was 0.842, Rsquare for wetted width was 0.783, and Rsquare for mean depth was 0.909. This would indicate that mean depth has much better fit to the regression than the other two variables do. Wetted width has the lowest Rsquare, which makes sense as eventually with increased discharge the wetted width will not change as much at the upper limits. The estimates of coefficients for the three were: v= 0.1072Q^2.4986 w= 35.7643Q^ 1.6573 d= 0.2608Q^2.4149


The flood frequency analysis I created gave me information on recurrence intervals of Walker Creek at Bane, Va. The data fit the assumed distribution well, except for a few outliers from 2 extreme floods in 1992 and 1878. The 1,2,5, and 10 year recurrence intervals were determined to be 2000 cfs, 6000 cfs, 10000 cfs, and 11000 cfs respectively.


Issue Paper
I did my issue paper on water quality criteria for sediment. I was interested in this subject due to the fact that I notice sediment problems in streams I work in frequently for work at the Virginia Tech Freshwater Mollusk Conservation Center. I went into it wanting to understand why sediment criteria has not been set up on a national scale for the protection of streams and their animal communities. I learned a great deal from this paper, and understand now how hard it is to make national ambient water quality criteria for natural pollutants like fine sediments. I think many states are noticing the effects of sediments on the aquatic ecosystems in their regions and are moving forward with better standards and better science to back them up for the future.
Developing Water Quality Criteria for Suspended and Bedded Sediments

Developing Water Quality Criteria for Suspended and Bedded Sediments
Introduction
Excess fine sediment in streams is a human-caused issue that has likely been around a very long time and it isn’t going away soon. As urban and suburban populations continue to grow and agriculture needs increase, erosion and runoff in our country’s streams will only continue to escalate unless drastic steps are taken. Unfortunately, this will not be beneficial to local communities of aquatic wildlife. There are scientific articles dating back as far as seventy-five years that associate excess sediment with impairment to aquatic wildlife (i.e. Ellis 1936). The Clean Water Act of 1972 was created specifically to fix and maintain integrity of our nation’s water supply and “to provide, wherever attainable, water quality for the protection and propagation of fish, shellfish, and wildlife.” Ambient water quality standards have been put in place for parameters such as dissolved oxygen, bacteria and ammonia, but not sediment. Excessive, erosion, transport, and deposition of sediment are among the leading causes of impairment of habitat and water quality in streams and rivers throughout the United States (USEPA 2006). Together, excess sediments and nutrients account for more kilometers of impairment in assessed streams than anything else (Paul et al. 2008). Comparing reference yields of sediments to respective watershed yields, Simon and Klimetz 2008 showed that many states were outrageously over median values for stable streams. Iowa streams exceeded the median value for stable streams by 243%, while New York was 290% above, Mississippi was 630% above, and Oklahoma was between 2,120% and 7,410% above. So, why haven’t standards been set up for sediment? “Although the U.S. Environmental Protection Agency (EPA) has a mandate under Clean Water Act Sections 104 and 304 to develop sediment criteria, the agency has only recently focused attention on sediment impairments in aquatic ecosystems (Bryce 2008).” Many states have set standards for sediments, but few are consistent (Berry et al. 2003). Criteria will need to involve identification of biological effects and then organism responses to those effects. The focus of this paper is to first identify causes to how and why excess sediment fines cause biological impairment to stream ecosystems, and then to address the need for the development of biologically based sediment criteria for streams. With biologically based sediment criteria, managers should be able to better identify impaired reaches and create remediation plans in given reaches of streams that best benefit the local aquatic fauna they wish to protect.
What is fine sediment and where does it come from?
Paul et al. 2008 defined sediments (in the sense of aquatic biological pollutants) as organic and inorganic particles that are suspended in, carried by, or accumulate in waterbodies. Frequently the terms “fines” and “sedimentation” are used in their broadest sense by freshwater scientists (Wood and Amritage 1997). However, it seems to be common practice to consider particle sizes of 0.06mm or less “silt fines” in streams (Bryce et al. 2008, Bryce et al. 2010).
The supply of sediment from channel sources is strongly related to stream discharge and stability of the channel bed and banks. Sources include river banks subject to erosion, mid-channel and point bars subject to erosion, fine bed material stored in the stream bed, natural backwaters and fine particles trapped in aquatic macrophytes or vegetation. On the other hand, the supply of sediment from non-channel sources may be highly unpredictable depending on its source and mode of transport in a given stream. The sources of these sediments are exposed soils subject to erosion that is then transported through runoff, mass failures within the catchment such as landslides, urban areas that increase volume of runoff and erosion and litter from terrestrial sources such as trees (Wood and Armitage 1997).
From cropland alone, approximately 17 tons ha-1 yr-1 of soil are eroded in the U.S. from combined water and wind causes, and an estimated 60% of this tonnage is deposited in streams and rivers (Pimentel et al., 1995). This seems like much more than streams in a pre-disturbed natural state would ever have needed to deal with. Also, forest removal can increase erosion inputs. Dale Jones et al. 1999 showed habitat diversity decreased and riffles became filled with fine sediments as upstream deforested patch length increased. They concluded riparian buffer length in forested areas should be given strong concentration in stream protection plans.
Sediment obviously has plenty of ways to find its way into streams. Streams are built to naturally deal with this and even require this on smaller scales in undisturbed states. Unfortunately, by channelizing streams, building dams to lessen the effects of flooding, destroying riparian buffers, and increasing runoff, humans have inhibited many streams to function as nature intended.
How does sediment affect aquatic fauna and biological processes?
Detrimental effects from excess sediment in streams are numerous for aquatic organisms. From primary production to macroinvertebrates and vertebrates, suspended and bedded sediments have been shown to have direct and indirect effects on organisms’ abilities to survive and function properly. In the Cenozoic, North America was covered by forests (Williams 1989). Due to this, stream species throughout the continent likely evolved to live in forested watersheds with many riparian buffers to high loads of sediments. Now that humans arrived, these species are living in a variety of forested and unforested streams. “High and sustained levels of sediment may cause permanent alterations in community structure, diversity, density, biomass, growth and rates of reproduction and mortality. Impacts on aquatic individuals, population, and communities are expressed through alterations in local food webs and habitat (Henley et al. 2000).”
Primary production can be greatly affected by suspended sediments as it prevents light from reaching the algae, plants and phytoplankton that rely on it to grow. This in turn can lead to bottom up effects on zooplankton and macroinvertebrates that rely on the primary production for food. Decreases in these, obviously, could lead to decreases in food availability for vertebrates.
Macroinvertebrate assemblages can be greatly affected by excess sediments in the in-stream channel (Mebane 2001). EPT (Ephemeroptera, Plecoptera, Trichoptera) taxa richness is commonly used as a response measure to stream health. These creatures provide many benefits to stream ecosystems such as breaking down leaf litter, scraping periphyton off of substrate and provide fish species with food. A recent study showed fine sediment addition by researchers to cause quick reductions in moss cover and EPT richness in four separate reaches of streams in New Zealand compared to control reaches. (Mathaei et al. 2006). Mollusks may also be affected as the benthic environment is covered with layers of fine sediment. Ellis 1936 showed that 0.6 to 2.5 cm of silt caused significant mortality in one species of mussel. Studies on ubiquitous taxonomic groups such as crayfish and snails are mostly undocumented in scientific literature. Indirect effects to food for either of these taxa would likely lead to their decline (Henley et al. 2000).
Many streams fish studies have indicated detrimental effects from sedimentation. Trout growth may be reduced by suspended sediments as they directly alter behavior or stress fish in a way that reduces foraging activity and prey capture success. It was shown that trout observed feeding in channels prior to addition of sediment were noticeably more reactive, moving between cover objects and feeding areas more frequently and were exposed to predators for longer than control fish (Shaw and Richardson 2001). When deposited in riverbeds, fine sediment can reduce survival of embryos and emergence of fry from reds by decreasing dissolved oxygen and water exchange and trapping emerging fry (Chapman 1988). Juvenile salmonid growth and survival have also been linked to even small increases in sediment concentrations and it is suggested that any reduction of fine sediment in streams could benefit salmonid restoration (Suttle et al. 2004). Fish can’t see to feed if the sediment is suspended and in too high of a concentration. Abundance of fish that are benthic insectivores and herbivores has also been shown to be reduced as the percent of fine substrate increased (Berkman and Rabeni 1987). Fish requiring larger substrates in fast flows (riffle dwelling species) are going to be greatly impacted if fine silts fill up the interstitial habitat.
These and many other reasons are why our country’s stream managers will require national ambient water quality criteria for sediments to apply to watersheds for which they are supposed to be protecting. Biologically-based sediment criteria would indicate biological data are used to set sediment criteria that protect and maintain populations of these native, sediment-sensitive species. They would assume that a level of fine sediment accumulation exists beyond which assemblages of organisms are no longer able to sustain themselves (Bryce et al. 2008).
EPA Suspended and Bedded Sediments Framework and its Benefits
The EPA in 1999 stated that suspended and bedded sediments (SABS) are natural components of aquatic systems and do not cause adverse effects unless they are present in excessive or deficient amounts. When they are in excess there needs to be criteria created to quantify what levels need to be maintained to ensure biological integrity. The SABS framework created by the EPA in 2006 uses an ecological risk assessment approach and compares estimated effects with different candidate criteria values. These values come from information from multiple studies and data sets and use a variety of statistical methods. This framework may be applicable to selection of numeric targets for total maximum daily loads to adopt sediment standards in impaired waterbodies (Paul et al. 2008). The SABS framework provides a scientifically backed approach for detecting effect thresholds that is useful for nontraditional modes of action and risk. This is exactly what stream managers have needed, as certain wildlife react to nontraditional stressors like sediment. Quantifying minimum-effect thresholds is now possible with a variety of methods. Using a variety of methods gives a range of values that a particular method might not be able to attain. This method sets the stage for regulatory authorities to use scientifically derived knowledge about the effects of SABS to guide selection of ambient water quality criteria. Ecological knowledge gained during criteria development is also valuable for determining causes of biological impairments, developing risk estimates, and estimating necessary reductions to restore ecosystem function (Paul et al 2008).
Berry et al. 2003 noted some important issues to consider with using national criteria for SABS. They find that generalizations can be difficult because biological response to both increased suspended sediment and increased bedded sediment varies with species and sediment characteristics. Secondly, they found that after additional research it may be possible to develop national scientifically-defensible SABS criteria using the traditional “toxicological” does-response approach, but these criteria would have to incorporate some habitat-specificity in order to be widely applicable. Next they conclude some habitats that have not been well studied deserve more study, especially those habitats with moderate and variable amounts of SABS. Lastly, they note that many states have set criteria for SABS, but there is little consistency among them. West Virginia, for example, states criteria for increases in turbidity (percent light through water) from point and non-point sources in state waters (West Virginia DEP 2010). In contrast, Oregon is in the process of defining excessive sedimentation criteria based on percent fines data collected as part of the Environmental Monitoring and Assessment Program (Oregon DEQ 2006).
The first step in the 2006 EPA SABS framework is to review current designated uses and criteria for a set of waterbodies. Next the researcher would describe SABS effects on the waterbodies’ designated uses. They would then select specific SABS and response indicators and define potential ranges in value of the SABS and response indicators. Last they would identify a response indicator value that protects the designated use and analyze any response associations (Paul et al. 2008). Having this guiding framework is very useful for managers who need to attain knowledge on SABS, in that they don’t have to come up with individual game plans every time around.
Using this framework, Bryce et al. 2008 and Bryce et al. 2010 were able to quantify criteria for protecting sediment sensitive aquatic species in the western United States. Bryce et al 2010 concluded minimum-effect bedded surficial sediment levels for aquatic vertebrates (fish and amphibians) were 5% and 13%, respectively for % fines (less than 0.06mm) and % sand and fines (less than 2 mm). They also concluded for macroinvertebrates the minimum-effect levels were smaller (3% and 10%) for the two particle size ranges. The process for determining these values can be seen in Figure 1 and Table 1. Similarly, Cormier et al. 2008 show in a hypothetical example that criteria could be set up where 95% of EPT in mid-Atlantic highland streams would be protected when levels remained below 7% bedded sediment fines. With numbers like these, managers are given a goal to seek to achieve for a given stream. Perhaps, if managers are dealing with a target predatory fish in a given stream, they will know to aim for the macroinvertebrate minimum-effect levels to insure food abundance and richness for their targeted fish species. If macroinvertebrate abundance is discovered not to be important, but a fish species is still sensitive to excess sediment, they will still have the marginal target minimum-effect threshold to attain and maintain for the species.

Figure 1. Quantile regression at the 90th-quantile of aquatic vertebrate index of biotic integrity (IBI) scores on areal percent fine sediments for (A) mountain streams of the western USA and (B) Oregon and Washington Coast Range streams. Similarity beween the two regressions is indicated by the overlapping 95% confidence intervals (CIs) for slope coefficients. (Figure from Bryce et al. 2008)
Table 1. Areal percent fine sediments (particles less than or equal to 0.06mm), aquatic vertebrate index of biotic integrity (IBI) score, and percent change in IBI in response to increases in areal percent fines for stream reaches in the Mountains ecoregion of the western USA. The reference value (5% fines) represents the 75th percentile of the fines distribution for the 169 least disturbed sites in the region. Values of IBI were calculated from the 90th-quantile regression equation (see Figure 1). (Figure from Bryce et al. 2008)
Areal fines (%) | IBI | Change in IBI (%) |
0 | 86.5 | 1.8 |
5 | 85 | Reference |
10 | 82.5 | -2.9 |
16 | 80 | -5.9 |
20 | 78.5 | -7.6 |
30 | 74.5 | -12.4 |
40 | 70.5 | -17.1 |
50 | 66.5 | -21.8 |
60 | 62.5 | -26.5 |
70 | 58.5 | -31.2 |
80 | 54.5 | -35.9 |
90 | 50.5 | -40.6 |
Decreases in abundances of animals and increases in bedded sediments seem to be themes repeated throughout our country. Unfortunately, if you can’t somehow quantify how much the substrate has been altered, you won’t be able to tell how bad it is or isn’t. Having a quantifiable number like the one the SABS framework can supply is an important first step. With this in hand, managers can be sure of where they are and where they want to get. They can focus on the causes and figure out ways to decrease sedimentation, erosion and runoff. By monitoring the streams they have done this work to, they can then know if they are reaching their goal and providing the help certain species need. Bryce et al. 2008 do point out that managers and stakeholders may support less-stringent criteria for budgetary or political reasons, but they will be less protective of aquatic life potential.
An example where sediment criteria might prove useful is in the upper Tennessee River watershed. Being a hotspot for both fish and freshwater mollusks, pollutants of any kind could have far reaching detrimental effects on species richness and abundance. If it could be shown that high percentages of SABS was correlated to low fish and mussel species richness in reaches of stream in this region, managers would likely aim to lessen sediment loads throughout the watershed. In order to do this, they would need a benchmark number to focus their efforts on, and this type of number might only be achievable through a framework like the EPA has developed. By having a number established as an acceptable level, managers could identify reaches that were below the standard and figure out ways to bring them up to par. Also, managers might be monitoring reaches that were well below the criteria, and could use the number as a threshold they would wish to stay away from for the sake of the animals.
The next step needs to be unifying these criteria among states and agencies. It isn’t helpful for states with similar streams and similar species assemblages to have completely different ambient water quality criteria for sediments. Turbidity in one state can’t be compared to percent bedded sediments in another, to draw any reasonable conclusions. Also, turbidity could be caused by one type of sediment or runoff in one stream while being caused by a completely different type of sediment or runoff in another. So, it might prove difficult to associate factors dealing with turbidity among different streams.
Conclusions
The SABS framework of the EPA seems to be a step in the right direction for developing ambient water quality criteria for the United States. There are two other promising methods being developed. One is field-derived species-sensitivity distributions. These are distributions patterned after the methods developed for criteria development based on toxicity tests. In order to develop these distributions, effects levels for several species that live in and are exposed to conditions in a class of ecosystem are identified by using quantile regression models of field data (Paul et al. 2008). The other is specific tolerance values. This method models the relationship between an exposure measure and a taxon. After tolerance values are established for a group of organisms, the conditions of new sites can be assessed on the basis of whether taxa from tolerant of sensitive groups are predominantly collected (Yuan 2006). Regardless of which method is used, national criteria need to be created to help managers.
Future efforts could be undertaken in stream subclasses to refine criteria development efforts, specific to a given state, ecoregion, geological type, stream slope, stream power class, or taxon of interest (Bryce et al. 2008). Results indicate that IBI’s (indexes for biotic integrity) calculated for same stream type, at different regional scales and sample sizes, yielded very similar prediction for the potential response of IBI to fine sediments (Bryce et al. 2010). This could be immensely beneficial to stream habitat managers. It would help them quickly identify the problem and get them set on a path for a fix. It would also help in that when managers were presented with the job of tackling a sediment issue in a stream, they could compare their project with like projects in the same region.
The potential seems to be there for national criteria for SABS levels in streams being available to managers in the future. Even if national standards are not quantified, researchers should be able to attain ambient water quality criteria for sediment in local streams, by following the EPA SABS framework themselves. By helping the streams rid themselves of the sediment, the streams will likely respond with creating new habitats for extirpated wildlife to inhabit. This could help solve issues with connectivity in streams as more like habitats once again stretch longer distances through the stream. It could also provide more habitats for species whose habitats are very specific and rare due to sedimentation. Personally, I have observed stretches of the Clinch River in Virginia and Tennessee where this would apply in regards to freshwater mussels. Many of the endangered species of mussels residing in this bio hotspot require fast-moving, highly oxygenated riffles for survival. Due to urbanization in the upper reaches of the watershed, many riffles have been inundated with silt fines. Many other factors could have lead to the decreases in abundance and diversity of mussels in these areas, but it seems apparent that sediment has something to do with it. In lower reaches of the same river, the lack of human impacts have allowed individual shoals to hold as many as 50 species of freshwater mussels. The riffles in these areas are full of larger particles and loose sands and silt fines are only found where emergent vegetation has helped it to settle.
Legislature will need to be reviewed throughout the country and world for that matter regarding sediment as a pollutant and how it should be quantified and reduced. Further research will hopefully convince authorities to revise current standards. As part of the Clean Water Act, listed streams should have sediment criteria developed to go along with all of the other various water quality thresholds trying to be maintained. It seems that many like to get on bandwagons for issue such as this, but few are willing to be the first in line. If just one state or region would adopt more stringent criteria involving sediments, than perhaps many other states or the entire nation would follow.
Through research, it is noticeable that there is very little study being done outside the mountainous northwest of the United States on this issue. Future studies should be done to figure out if the same rules would apply to ecosystems across the nation. Species diversity is much higher in the Mississippi basin and could produce much different results from what researchers in mountainous salmonid streams might find.
We have the opportunity in this country to relay our findings to the developing world. We have already caused many of the excess sediment problems to our nation’s rivers from large-scale agriculture and developing land around streams. In nations where this has yet to occur, our findings could help them plan better than we did, as to preserving their own aquatic faunas. For example, something as easy as preserving riparian zones during land development could have significant positive effects on biotic and abiotic conditions in flowing waters (Henley et al. 2000). If sediment is one of the biggest pollutants to streams in our country it will be in others, so efforts should be made to prevent this from happening elsewhere.
In conclusion, we need national ambient water quality criteria for sediments in streams. If these criteria have been put in place for many other water quality parameters, there is no reason why we can’t develop them for sediments. Even region-by-region criteria would be better than what we have currently.
Literature Cited
Auld, A.H. and J.R. Schubel. 1978. Effects of suspended sediment on fish eggs and larvae: a laboratory assessment. Esuarine and Coastal Marine Science 6: 153-164.
Berkman, H.E. and C.F. Rabeni. 1987. Effect of siltation on stream fish communities. Environmental Biology of Fishes 18: 285-294.
Berry, W., N. Rubinstein, B. Melzian, and B. Hill. 2003. The biological effects of suspended and bedded sediments (SABS) in aquatic systems: a review. U.S. Environmental Protection Agency, Washington, D.C.
Bryce, S.A., G.A. Lomnicky, and P.R. Kaufmann. 2010. Protecting sediment-sensitive aquatic species in mountain streams through the application of biologically based streambed sediment criteria. Journal of the North American Benthological Society 29: 657-672.
Bryce, S.A., G.A. Lomnicky, P.R. Kaufmann, L.S. McAllister, and T.L. Ernst. 2008. Development of biologically based sediment criteria in mountain streams of the western United States. North American Journal of Fisheries Management 28: 1714-1724.
Chapman, D.W. 1988. Critical review of variables used to define effects of fines in redds or large salmonids. Transactions of the American Fisheries Society 117:1-21.
Cormier, S.M., P. Shaw-Allen, J.F. Paul, and R.L. Spehar. 2009. Estimation of effect thresholds for the development of water quality criteria. Real-time and deliberative decision making: NATO Science for Peace and Security Series C: Environmental Security. 2: 159-178.
Dale Jones, E.B. G.S. Helfman, J.O. Harper, and P.V. Bolstad. 2003. Effects of riparian forest removal on fish assemblages in southern Appalachian streams. Conservation Biology 13: 1454-1465.
Ellis, M.M. 1936. Erosion silt as a factor in aquatic environments. Ecology 17(1):29-42.
Henley, W.F., M.A. Patterson, R.J. Neves, and A.D. Lemly. 2000. Effects of sedimentation and turbidity on lotic food webs: a concise review for natural resource managers. Reviews in Fisheries Science 8: 125-139.
Matthaei, C.D., F. Weller, D.W. Kelly, and C.R. Townsend. 2006. Impacts of fine sediment addition to tussock, pasture, dairy and deer farming streams in New Zealand. Freshwater Biology 51: 2154-2172.
Mebane, C.A. 2001. Testing bioassessment metrics: macroinvertebrate, sculpin, and salmonid responses to stream habitat, sediment, and metals. Environmental Monitoring and Assessment 67: 293-322.
Oregon Department of Environmental Quality. 2006. Assessment methodology for Oregon’s 2004/2006 integrated report on water quality status. Available: http://www.deq.state.or.us/ wq/assessment/docs/methodology0406.pdf (December 2010).
Pimentel, D., C. Harvey, P. Resosudarmo, K. Sinclair, D. Kurz, M. McNair, S. Crist, L. Shpritz, L. Fitton, R. Saffouri, and R. Blair. (1995) Environmental and economic costs of soil erosion and conservation benefits. Science 267: 1117–1123.
Paul, J.F., S.M. Cormier, W.J. Berry, P.R. Kaufmann, R.L. Spehar, D.J. Norton, R.E. Cantill, R. Stevens, W.F. Swietlik, and B.K. Jessup. 2008. Developing water quality criteria for suspended and bedded sediments. Water Practice 2(1). Water Environment Federation.
Shaw, E.A. and J.S. Richardson. 2001. Direct and indirect effects of sediment pulse duration on stream invertebrate assemblages and rainbow trout (Oncorhynchus mykiss) growth and survival. Canadian Journal of Fisheries and Aquatic Sciences 58: 2213-2221.
Simon, A. and L. Klimetz. 2008. Relative magnitudes and sources of sediment in benchmark watersheds of the conservation effects assessment project. Journal of Soil and Water Conservation 63: 504-522.
Suttle, K.B., M.E. Power, J.M. Levine, and C. McNeely. 2004. How fine sediment in riverbeds impairs growth and survival of juvenile salmonids. Ecological Applications 14: 969-974.
U.S. Environmental Protection Agency. 2006. Framework for developing suspended and bedded sediments (SABS) water quality criteria, U.S. EPA/822-R-06-001, Washington, DC.
West Virginia Department of Environmental Protection. 2010. Title 47 Legislature rule Department of Environmental Protection Water Resources: Series 2 Requirements Governing Water Quality Standards. Available: http://www.dep.wv.gov/WWE/ Programs/wqs/Documents/47-02.pdf (December 2010).
Williams, M. 1989. Americans and their forests: a historical geography. Cambridge University Press, New York.
Wood, P.J. and P.D. Armitage. 1997. Biological effects of fine sediment in the lotic environment. Environmental Management 21: 203-217.
Yuan, L. 2006. Estimation and application of macroinvertebrate tolerance values. EPA/600/P-04-116F. U.S. EPA, Washington, D.C.
Trip Report for Crab Creek, Christiansburg, Virginia

On December 11, 2010. Shannon White, Ben Dickinson and myself surveyed a reach of Crab Creek in Christiansburg, Virginia. The reach was located in front of the newly developed aquatic center off of Franklin street. The reach was highly modified for the creation of the aquatic center, with huge culverts being built on either end of the reach for the creation of a parking lot and road crossing. The banks were stabilized with massive amounts of rip rap and underground sewers ran the length of the reach on both sides.
A sketch of the reach from my notes


Our crew decided to measure and develop cross section profiles at one riffle and one pool. We also did a pebble count consisting of ten pieces of substrate from each of 4 riffles and 2 pools. We determined bankfull from the noticeable change in vegetation type and the fact that grasses located within the channel were still pushed over from a recent high water event. These are some of my notebook entries from the survey.


Our results gave us these two cross-section profiles.


Key Principles of Stream Habitat Management
These are key principles I developed for stream habitat management throughout the course of the semester.
They are separated into best practice principles and best available science principles.
1) The strategy for rehabilitating a stream is dependant on primary goals of the project (i.e. fisheries, biodiversity, aesthetics). “Best Practices Principle”
2) Goals for stream restoration should be realistic. “Best Practices Principle”
3) Stream Habitat rehabilitation is expensive. So, managers should plan accordingly. “Best Practices Principle”
4) The natural system in question must be properly evaluated to determine an appropriate management system. This may require a standardized evaluation method. “Best Available Science Principle”
This principle seems to have been studied pretty extensively as there is much debate on evaluation methods.
Roper, B.B., J.L. Kershner, E. Archer, R. Henderson, and N. Bouwes. 2002. An evaluation of physical stream habitat attributes used to monitor streams. Journal of the American water resources association 38: 1637-1646.
5) Management activities need to take into account stream changes on a spatial and temporal scale. “Best Available Science Principle”
This is somewhat common sense, due to the fact that many scientists study geomorphology independently of stream habitat management and have relayed information on it.
Sear, D.A. 1994. River restoration and geomorphology. Aquatic conservation: marine and freshwater ecosystems 4: 169-177.
6) Effective management strategies will require cooperation between, and equal input from, scientists, funding agencies, property owners, and other stakeholders. “Best Available Science Principle”
This principle has been studied extensively as many managers have had to find this out for themselves the hard way. Conceptual frameworks and guides have been created to assist managers in approaching this most effectively.
Rhoads, B.L., D. Wilson, M. Urban, and E.E. Herricks. 1999. Interaction between scientists and nonscientists in community-based watershed management: emergence of the concept of stream naturalization. Environmenal management 24: 297-308.
7) Value systems within human populations have been the driver of most stream habitat problems. “Best Practices Principle” pretty much common sense…
8) Two forces (stream protection and economic development and use) must be balanced by good managers of stream habitat. “Best Practices Principle”
9) Managers should realize that a lag in the temporal scale makes it difficult to connect stream metrics to their effects on organisms. “Best Practices Principle”
10) Active adaptive management, though costly and risky, is a necessary approach to rehabilitating streams due to the large time scales many stream functions work on. “Best Available Science Principle”
This principle has been studied a lot recently, due to the fact that scientists know it is necessary for success in large-scale, expensive operations.
Prato, T. 2003. Adaptive management of large rivers with special reference to the Missouri river. Journal of the American water resources association 39: 935-946.
11) Stream ecosystems develop in unpredictable fashion and have dynamic equilibrium. “Best Available Science Principle”
This has been studied more recently to incorporate more ecosystem approaches to stream habitat management.
Minshall, G.W. 1988. Stream ecosystem theory: a global perspective. Journal of the North American Benthological society 7: 263-288.
12) Streams require a mosaic of interdependent habitats, in order to provide different species and communities with habitats suitable to their survival and fitness. “Best Available Science Principle”
This principle has been important to researchers for decades as they have attempted to save many types of species in streams.
Gorman, O.T. and J.R. Karr. 1978. Habitat structure and stream fish communities. Ecology 59: 507-515.
13) Biological monitoring and biological endpoints provide the most integrative view of river condition, or river health. “Best Available Science Principle”
This has been recently studied to convince other scientists, biological metrics are appropriate indicators in streams.
Norris, R.H. and M.C. Thoms. 1999. What is river health? Freshwater biology 41: 197-209.
14) Monitoring, after rehabilitation efforts in streams, is essential in the final evaluation of success or failure. “Best Available Science Principle”
This has been studied a lot due to the fact that lots of money goes into stream rehabilitation efforts. Bosses want to know if their money has been well spent.
House, R.A. and P.L. Boehne. 1985. Evaluation of instream enhancement structures for salmonid spawning and rearing in a coastal Oregon stream. North American journal of fisheries management 5: 283-295.
15) Monitoring successes and failures need to be shared among agencies and researchers to aid others in nation-wide and world-wide stream rehabilitation efforts. “Best Available Science Principle”
This is a new principle as scientists begin to realize the lack of success and failure literature available across the United States with regards to stream restoration.
Bernhardt, E.S., M.A. Palmer, J.D. Allan, G. Alexander, K. Barnas, S. Brooks, J. Carr, S. Clayton, C. Dahm, J. Follstad-Shah, D. Galat, S. Gloss, P. Goodwin, D. Hart, B. Hassett, R. Jenkinson, S. Katz, G.M. Kondolf, P.S. Lake, R. Lave, J.L. Meyer, T.K. O’Donnell, L. Pagano, B. Powell, E. Sudduth. 2005. Synthesizing U.S. river restoration efforts. Science 308: 636-637.
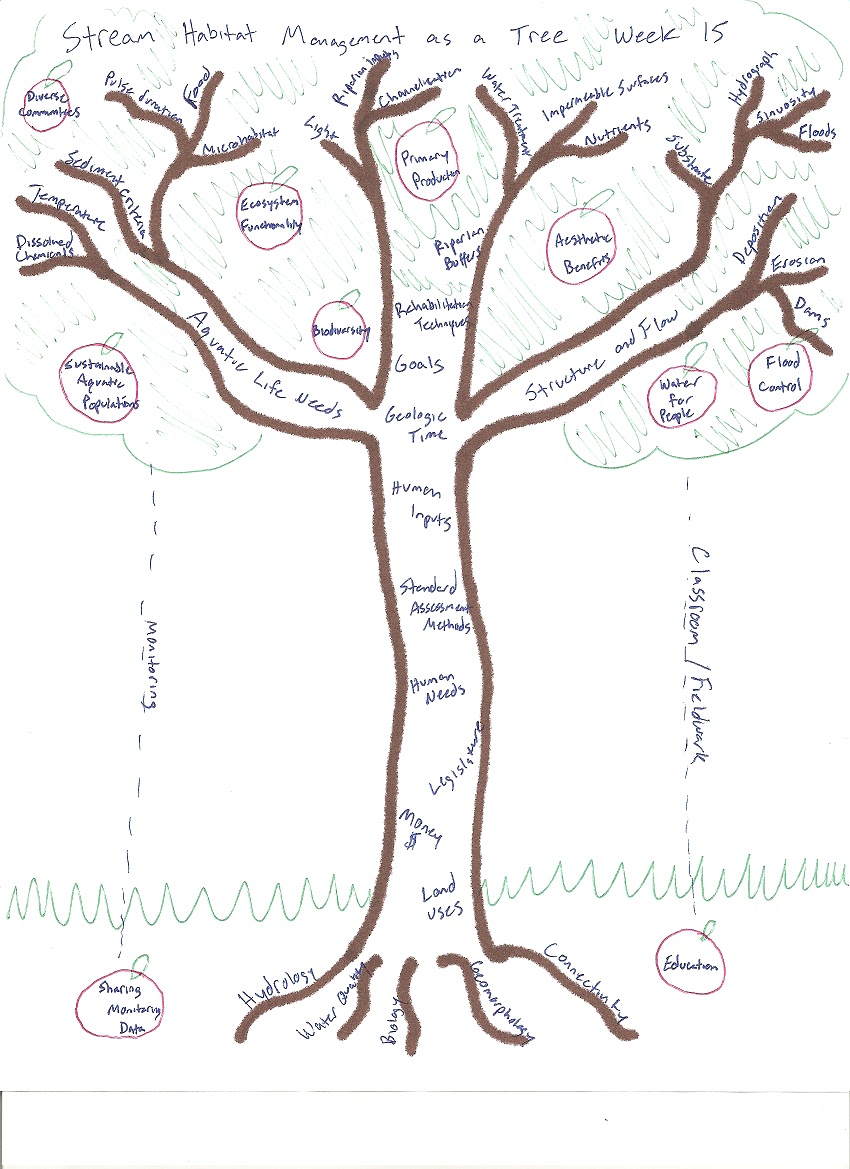
Trees of Knowledge

Sunday, December 12, 2010
Dear Dr. Orth Letter written week 1 of class
This was my original letter to Dr. Orth from the first week of class. I was required to write this letter describing my current knowledge of the subject and my interests, as well as what I wanted to learn this semester.
Dear Dr. Orth,
My name is Tim Lane. I am a research specialist for the Freshwater Mollusk Conservation Center at Virginia Tech. I received my undergraduate degree in Fisheries Science from Virginia Tech in 2008. Before finishing my degree I became involved with graduate students doing mussel research, and later worked myself into my current position. Through my experiences in the field and in the lab, I have developed a true passion for assisting in the rehabilitation of endangered mussel populations. I have the intentions of receiving a graduate degree at some point in the future and that is why I am taking a graduate level course. This class was very appealing to me as I believe stream habitat management will play a crucial role in the future for preserving endangered freshwater mussel populations. I intend to work hard and gain as much knowledge from your class as possible. I plan to use this knowledge in the future to assist in conservation efforts I have the privilege of being involved in.
My experience in streams mostly has involved fish sampling and collection through backpack electro-shocking, and mussel sampling and collection through snorkeling techniques. My experience with fish sampling came from assisting Jamie Roberts with his monitoring of the Roanoke logperch for a summer. Through this experience, I learned a lot about stream channel alteration, as the Corps of Engineers has done a lot of work to help with flood control in the Roanoke valley. I also spent a summer working for Brett Ostby with his work for TVA all across southwestern Virginia and Tennessee. Through this job, I got a true appreciation for the variety of streams the region has to offer. I worked in streams that were no more than ditches on farm land up to the main stems of the Clinch, French Broad and Holston rivers (and found mussels residing in almost all of them). My work with Brett was probably the closest experience to many of the concepts I expect to come across in this course.
With my work at the mussel lab, I have spent a lot of time on the bottom of various streams across Virginia and Tennessee. I have worked in streams no more than a few inches deep crawling on my knees up to streams 50 feet deep with scuba gear. The large majority of streams we work in have been altered for farming, water retention and industry. It has been easy to conclude that human priorities have been held in higher regard in these streams than those of the animals residing in them. I am familiar with viewing many habitat alterations in these streams. Human activities such as cattle farming, damming, coal mining, and clear cutting appear to have played the largest rolls in these alterations.
Unfortunately, I think I am quite ignorant when it comes to terms and techniques involved in stream habitat management. The little experience I do have has come from working with Brett and Jamie, collecting data on aspects of habitats their respective organisms were residing in. As a technician, I was a data collector, not an analyzer. I have gained experience measuring physical aspects of streams including, wetted width, bank full width, bank and slope angles, depth, temperature, velocity, dominant substrate, dominant vegetation, and rates of substrate embeddedness. The tools I used to assist in these measurements were a flow meter, a gravelometer, a clineometer, and various measuring tapes and sticks. I have experience measuring different parameters of water quality from my current position at the mussel lab. I am very familiar with using a dissolved oxygen meter, a pH meter, a salinity meter and a conductivity meter. I also know how to use various Hach methods for studying ammonia levels, nitrite levels, and chlorine levels in water. In addition, I have work experience analyzing organic matter in given volumes of water, as well as chlorophyll levels.
I am very comfortable with being out in streams and collecting data on their many measurable aspects. Honestly, I don’t exactly know what to do with the data or how to reach intelligent conclusions with it. My main goal of this class would be to learn just how to do this. As far as the terms from the survey go, I would say I have never heard of half of the terms. The other half I have heard of through various undergraduate courses I have taken. Unfortunately, I feel I have a clear understanding of only a small number of these terms. I therefore am expecting to learn very much this semester from your class. I am aware I cannot become a master of all of these terms and concepts in a semester, but I do look forward to working with you and stepping somewhat in that direction from my time spent in Stream Habitat Management.
Cheers,
Tim Lane
My Portfolio
 My name is Tim Lane. I am a fisheries student at Virginia Tech with an interest in freshwater ecology, specifically stream fishes and freshwater mussels. Freshwater mussel populations are in sharp decline throughout the United States and loss of habitat has been one of the contributing factors. I decided to take this class to better prepare myself for a future that might involve rehabilitating stream habitats for these little creatures.
 This is my portfolio for Stream Habitat Management 2010 at Virginia Tech taught by Don Orth. The intention of this portfolio is to document what I learned this semester.
Subscribe to:
Posts (Atom)